IF a source location is known and then we need NEFD (Noise Equivalent Flux Density: the level of flux density required to be equivalent to the noise present in the system, from Wikipedia), namely the sensitivity of the instrument, to estimate the integration time needed to do the observation. Usually, the NEFD can be expressed as the flux density per square root of integration time, ![]() . For a single bolometer, we can express the relation as below,
. For a single bolometer, we can express the relation as below,
(1) ![]()
and the ![]() is the exposure time of the bolometer while
is the exposure time of the bolometer while ![]() is the RMS of the map.
is the RMS of the map.
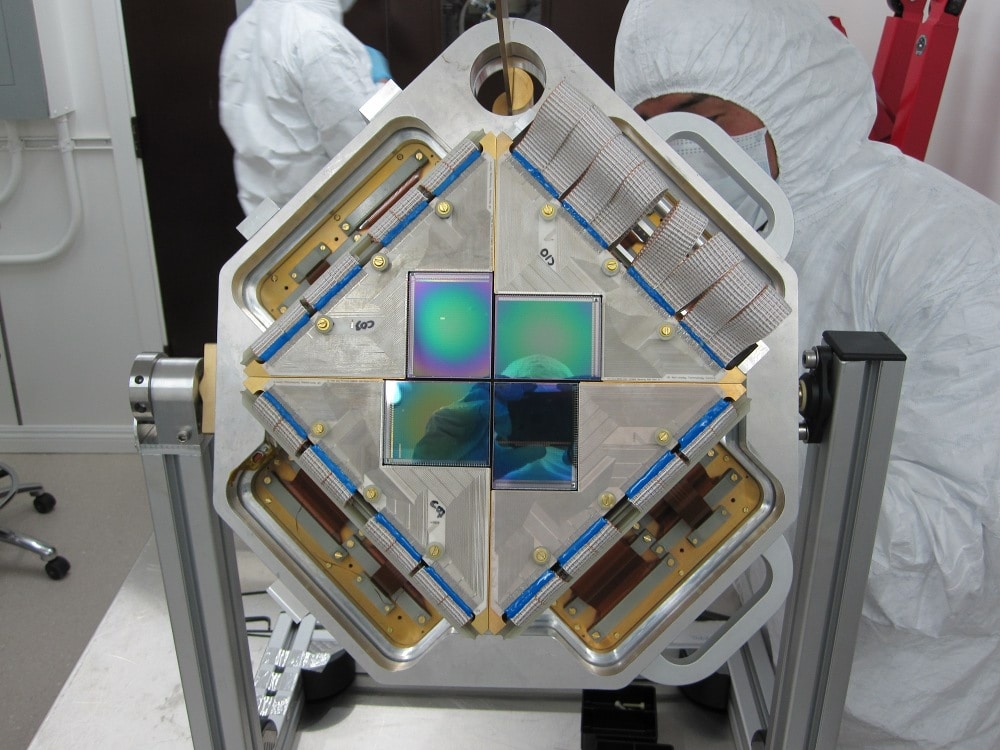
Let’s consider the SCUBA-2. SCUBA-2 is a TES-based submillimetre camera who has 10,000 pixels mounted on the JCMT(James Clerk Maxwell Telescope). It has a 7×7 arcmin FoV at both 450![]() and 850
and 850 ![]() . So, in fact, SCUBA-2 is made of 10,000 pixels, and this will make some difference to the Eq.(1). Also, we must consider the practical observation is not just simply mapping the object still. It will use some pattern to be sure of the full sampling. For SCUBA-2, they design mainly two kinds of mapping mode. One is for the small and compact sources (mainly stars or planets in the Galaxy or some extragalactic objects) of order 3′ or less. This mode is called CV Daisy. Another pattern is called PONG patterns, whose shape is close to a rectangle. SCUBA-2 uses three kinds of PONG patterns for mapping larger fields, mainly Galactic regions or very nearby galaxies. Those patterns contain three sizes: 900″×900″, 1800″×1800″ and 3600″×3600″, and each of them has 11, 5 and 8 rotations of the field respectively. So we must consider how the telescope mapping the field when calculating the exposure time from the observation time (Elapsed Time). However the formula is complicated (you need to consider a lot of things as patterns, beam size and the size of the objects, etc), but SCUBA-2 12A Call for Proposals Page gives the formula in a simple way:
. So, in fact, SCUBA-2 is made of 10,000 pixels, and this will make some difference to the Eq.(1). Also, we must consider the practical observation is not just simply mapping the object still. It will use some pattern to be sure of the full sampling. For SCUBA-2, they design mainly two kinds of mapping mode. One is for the small and compact sources (mainly stars or planets in the Galaxy or some extragalactic objects) of order 3′ or less. This mode is called CV Daisy. Another pattern is called PONG patterns, whose shape is close to a rectangle. SCUBA-2 uses three kinds of PONG patterns for mapping larger fields, mainly Galactic regions or very nearby galaxies. Those patterns contain three sizes: 900″×900″, 1800″×1800″ and 3600″×3600″, and each of them has 11, 5 and 8 rotations of the field respectively. So we must consider how the telescope mapping the field when calculating the exposure time from the observation time (Elapsed Time). However the formula is complicated (you need to consider a lot of things as patterns, beam size and the size of the objects, etc), but SCUBA-2 12A Call for Proposals Page gives the formula in a simple way:
Those formulae represent the observation time in a given transmission (which contains the declination and ![]() ) and the
) and the ![]() (in Jy/beam) you want to achieve. For example, if I want to know how long I should take to make a
(in Jy/beam) you want to achieve. For example, if I want to know how long I should take to make a ![]() detection of Stephan’s Quintet at
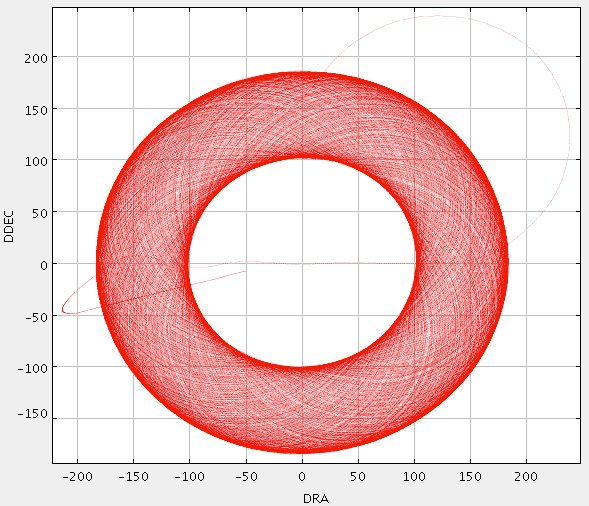
detection of Stephan’s Quintet at ![]() . Firstly, I need to know the size of the object and choose the right pattern, which turns out to be Daisy pattern as below.
. Firstly, I need to know the size of the object and choose the right pattern, which turns out to be Daisy pattern as below.

A “CV Daisy pattern”. The telescope executes a pseudo-circular pattern which keeps the target coordinate on the array throughout the integration. from: SCUBA-2 Support Information
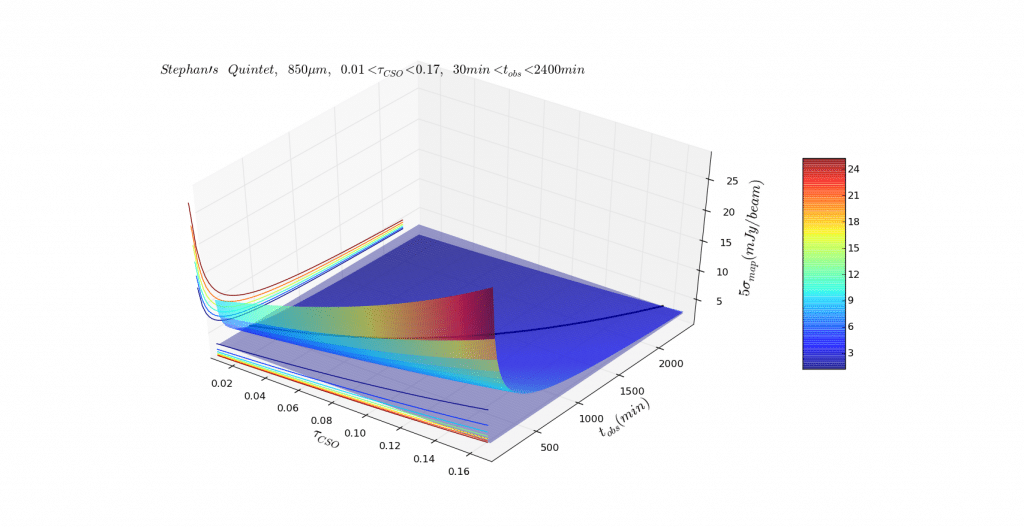
Secondly, I need to estimate the flux density from Hcg 92, which is 3 Jy/beam for a guess. Then I did a plot of ![]() ,
, ![]() and
and ![]() with the Hcg 92 flux plane across the surface, using a black line to show the intersection between to surface.
with the Hcg 92 flux plane across the surface, using a black line to show the intersection between to surface.
And the black line can be used to estimate the time you should use to observe the object. But in fact, I think this surface is just a beautiful figure more than a scientifically useful figure. And the most important information, in fact, is the black line, which can be represented in a 2D plot clearly. So, next time, I should make the figure clear and simple rather than beautiful.
Reference
http://www.jach.hawaii.edu/JCMT/continuum/scuba2/12ACfP/scuba2_12Acfp.html
http://www.jach.hawaii.edu/JCMT/continuum/scuba2/12ACfP/scuba2_12Acfp_support.html


